Back to Projects
Project Overview
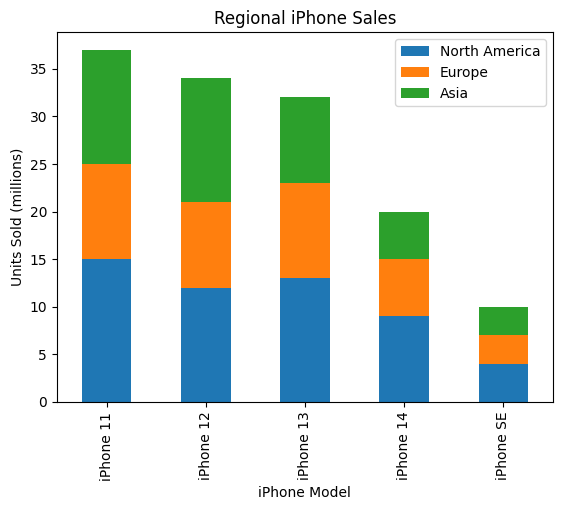
The notebook initializes NumPy arrays of units sold for ten iPhone models, then builds a DataFrame with columns for Model, Release Year, Base Price, and Units Sold (millions) . It also constructs a regional‐sales DataFrame and uses
tabulate to display summary tables. Finally, it employs Matplotlib to plot sales trends and compare model performances over time . Project Files
HTML File
Downloading is not permitted without the owner's permission.
Project Details
- Completion Date April 2025
- Category Data Analysis
- Project Type HTML File
Project Preview